python MBTI 이미지에서 matrix 데이터 추출하기
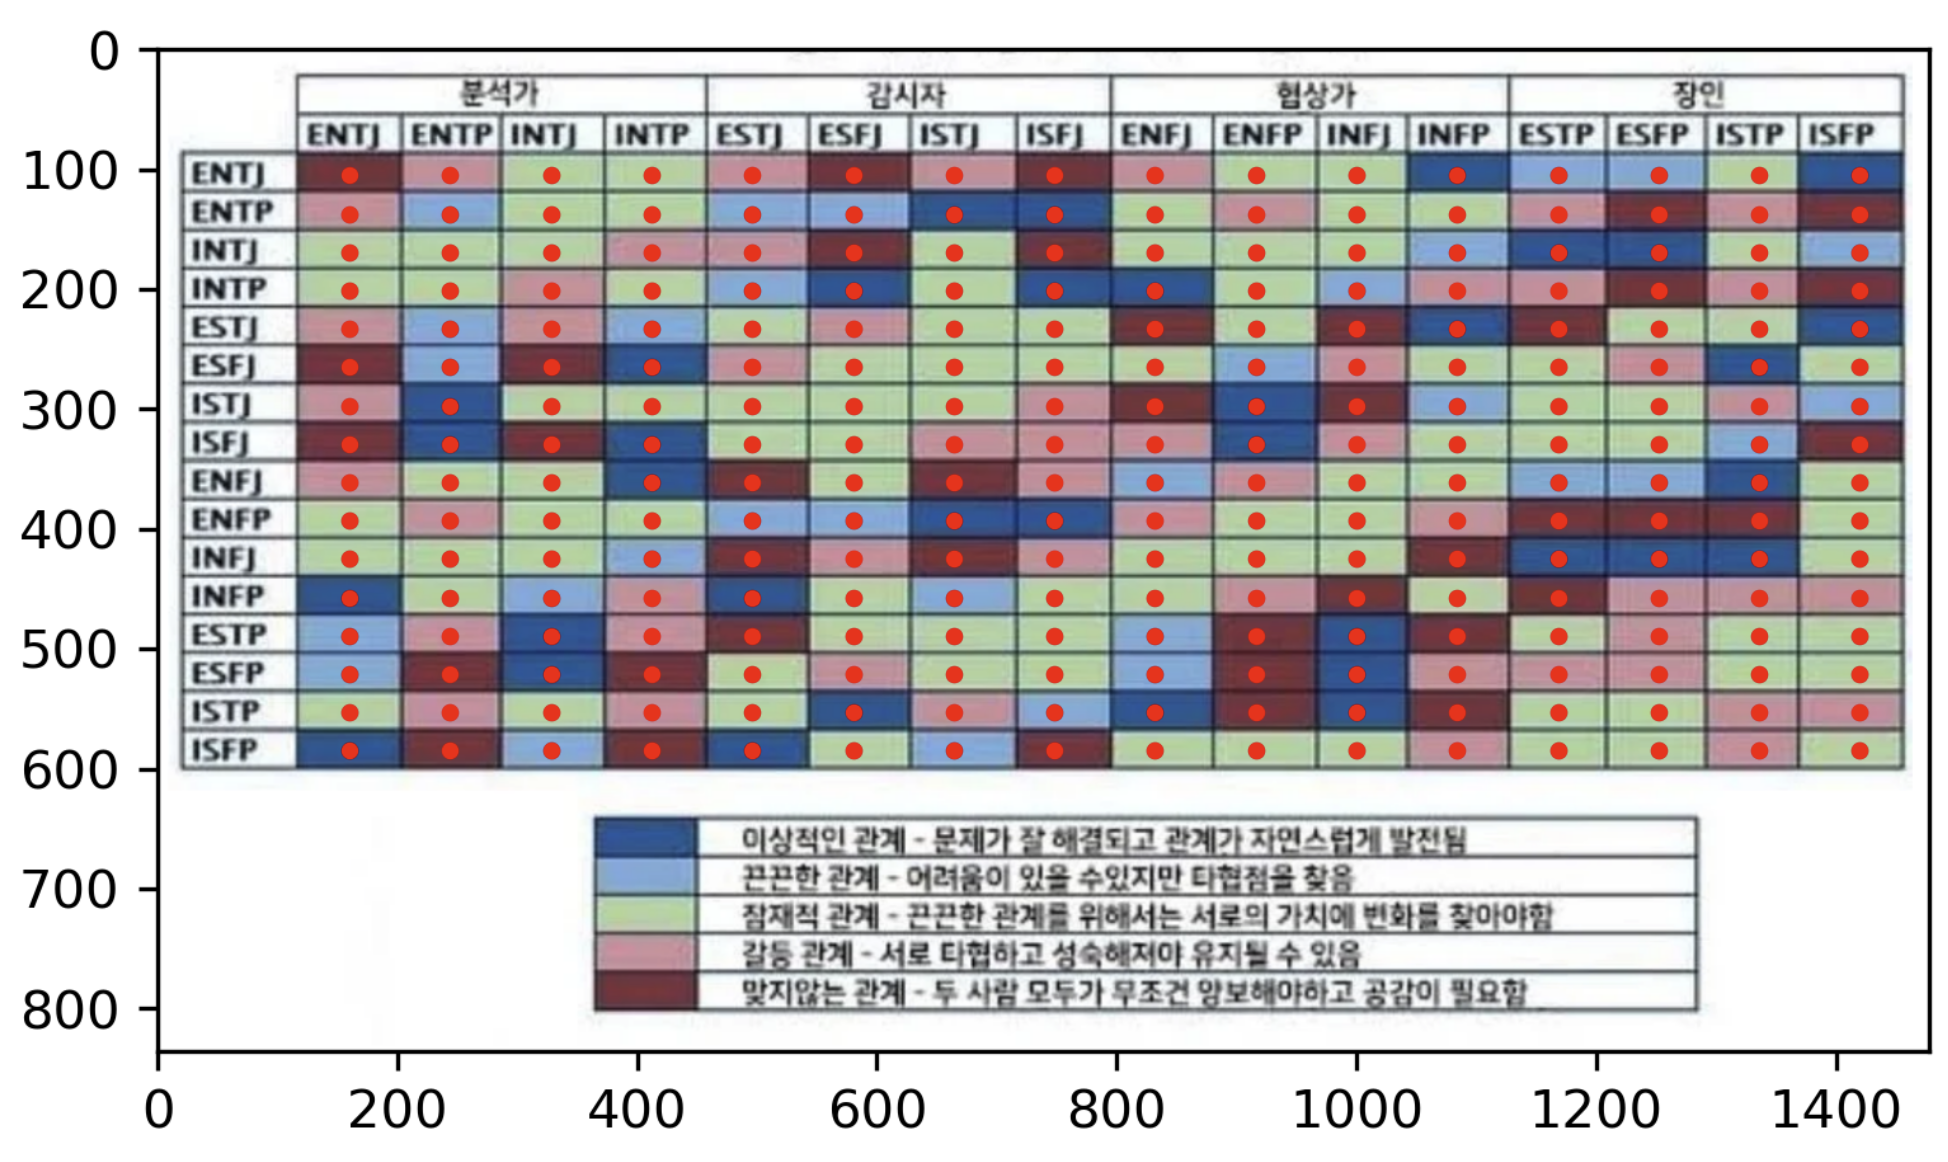
다음과 같은 png 파일에서 matrix를 뽑아내보자.

import numpy as np
from PIL import Image
from sklearn.manifold import MDS
import matplotlib.pyplot as plt
먼저 파일을 불러온다.
im = Image.open('matrix.png')
색상 정보를 뽑아오기 위해 점을 찍어본다. 약간의 노가다로 위치를 맞춰주었다.
rgb = im.convert("RGB")
start_width = 160
block_width = 84
start_height = 105
block_height = 32

plt.figure(dpi=300)
plt.imshow(im)

rgbmat = np.zeros((16,16,3), dtype=int)
for i in range(16):
    for j in range(16):
        cur_point = (start_width+block_width*i,start_height+block_height*j)
        rgbmat[i][j] = rgb.getpixel(cur_point)
        plt.scatter(*cur_point, s=5, c='red', marker='o')
plt.show()
rgbmat.shape

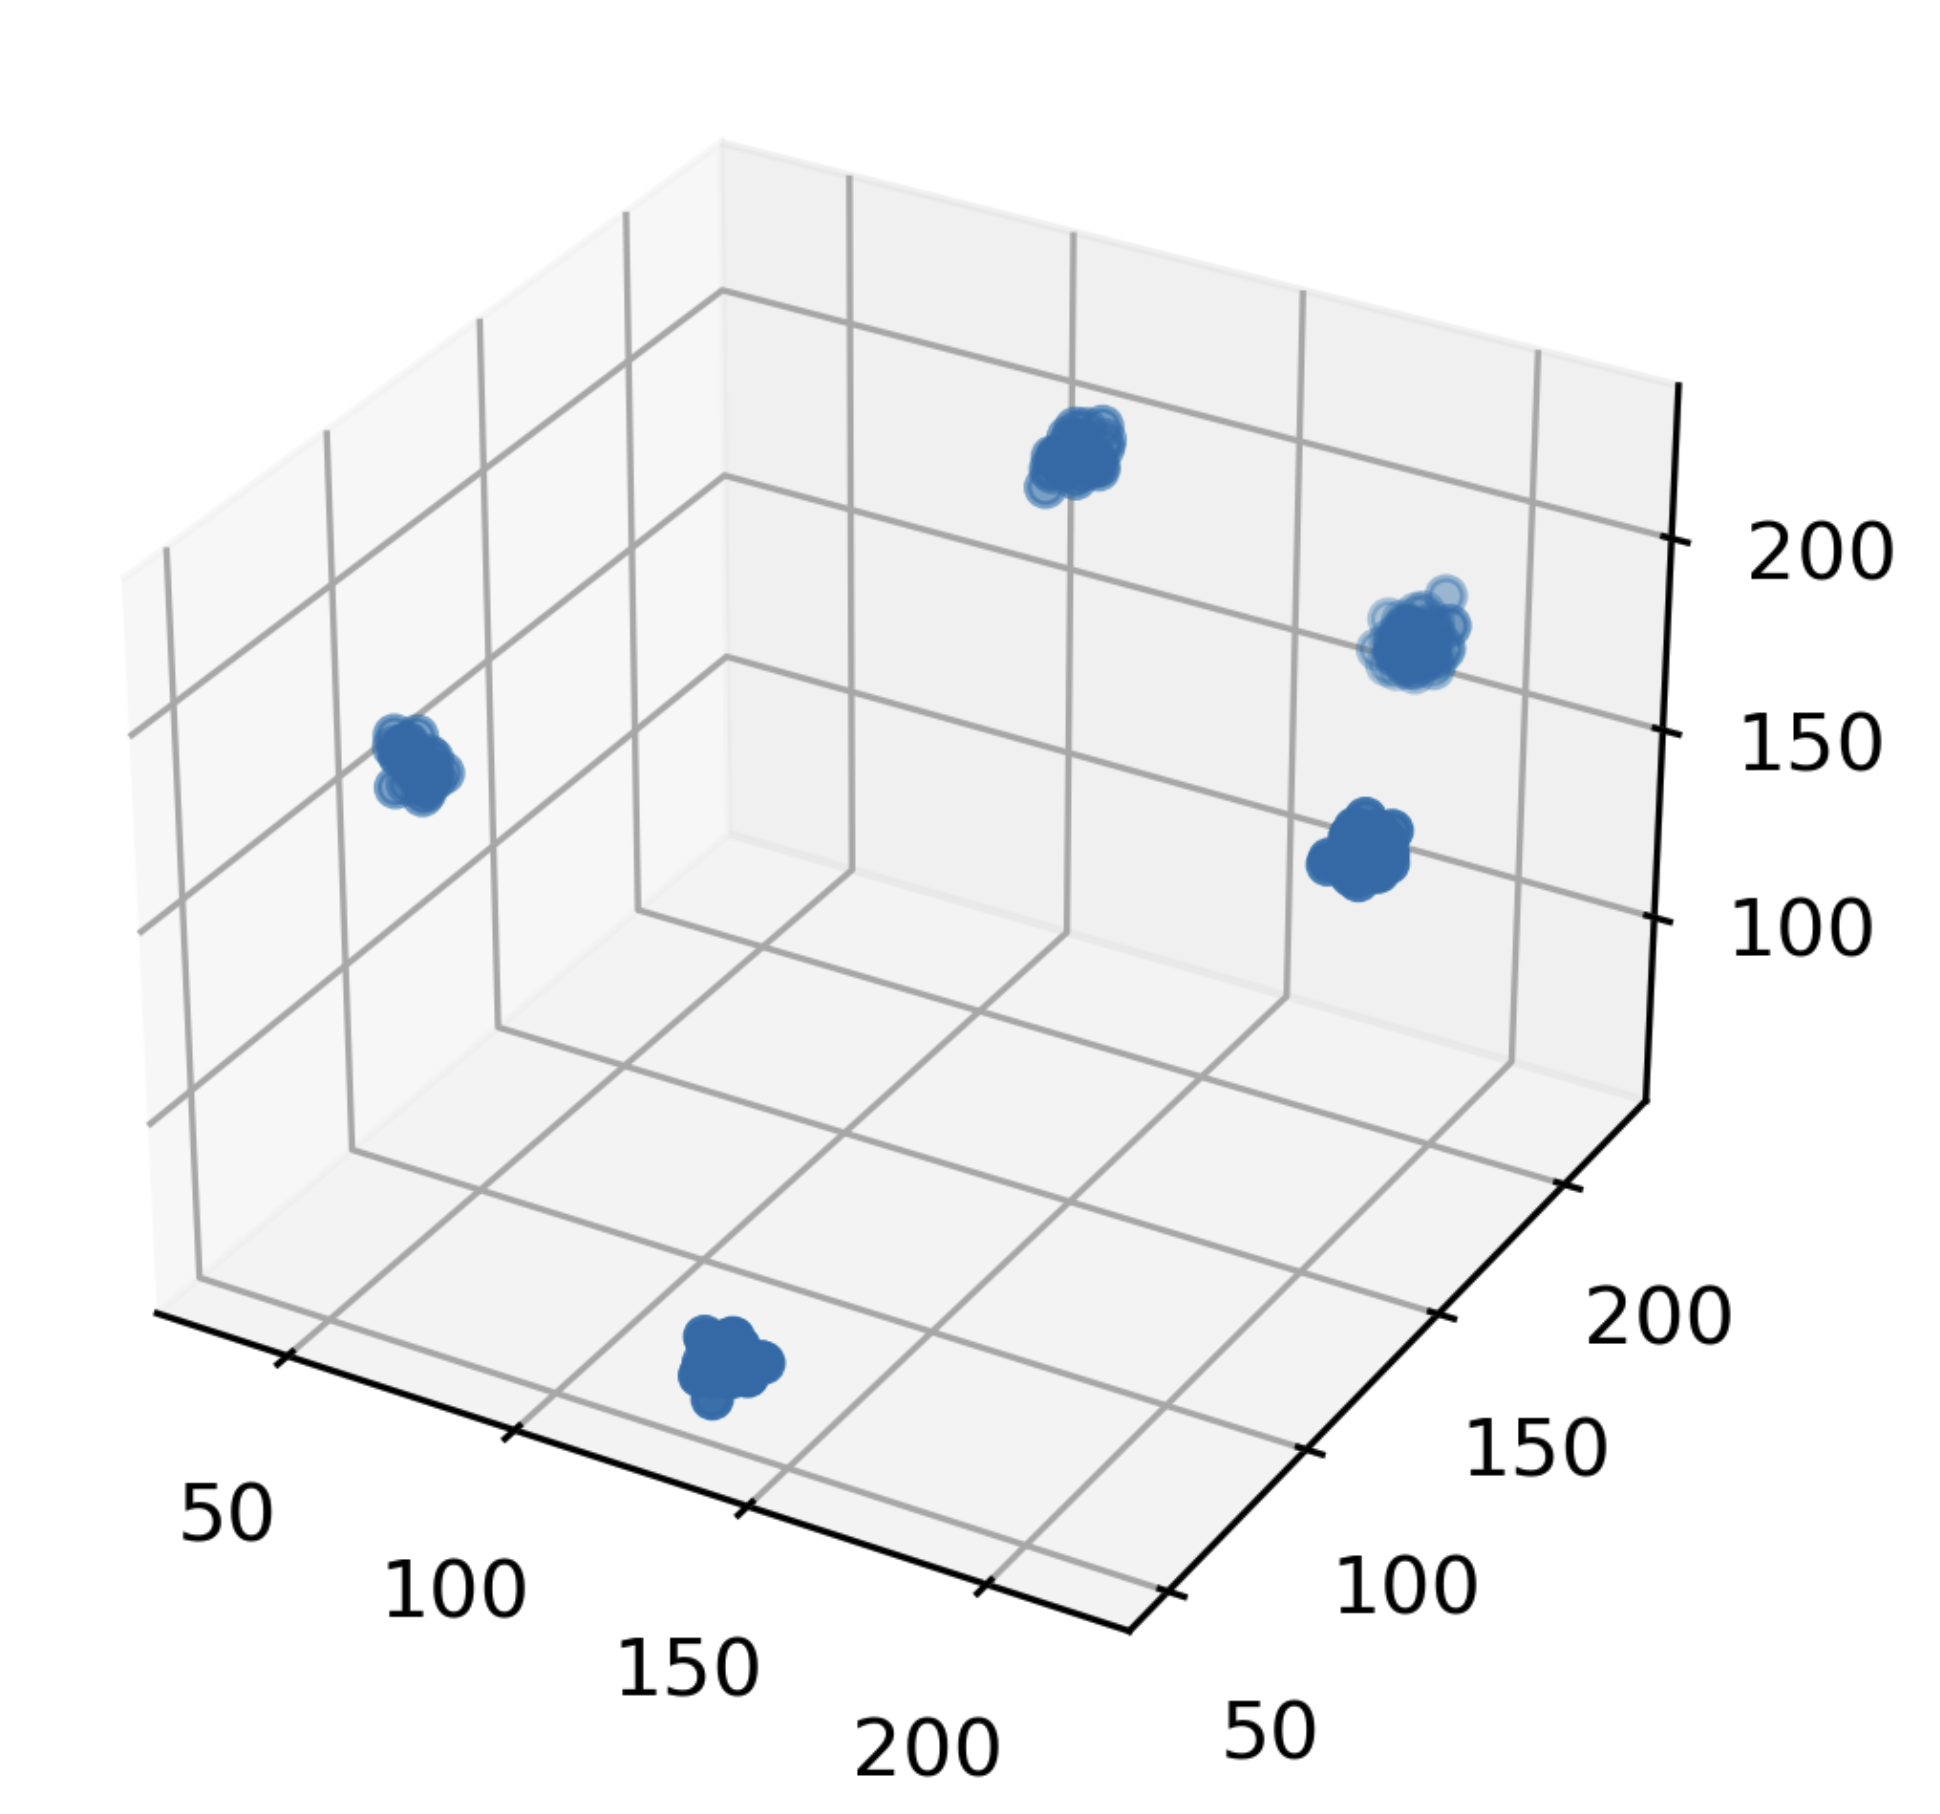
RGB값들이 일정하지 않기 때문에 k-means 를 사용해서 색상을 매핑해 줄 것이다. 먼저 RGB값들을 plot해 본다.
from mpl_toolkits.mplot3d import Axes3D
fig = plt.figure(dpi=300)
ax=fig.add_subplot(111, projection='3d')
data = rgbmat.reshape(-1, 3)
ax.scatter(data[:,0],data[:,1], data[:,2])
plt.show()

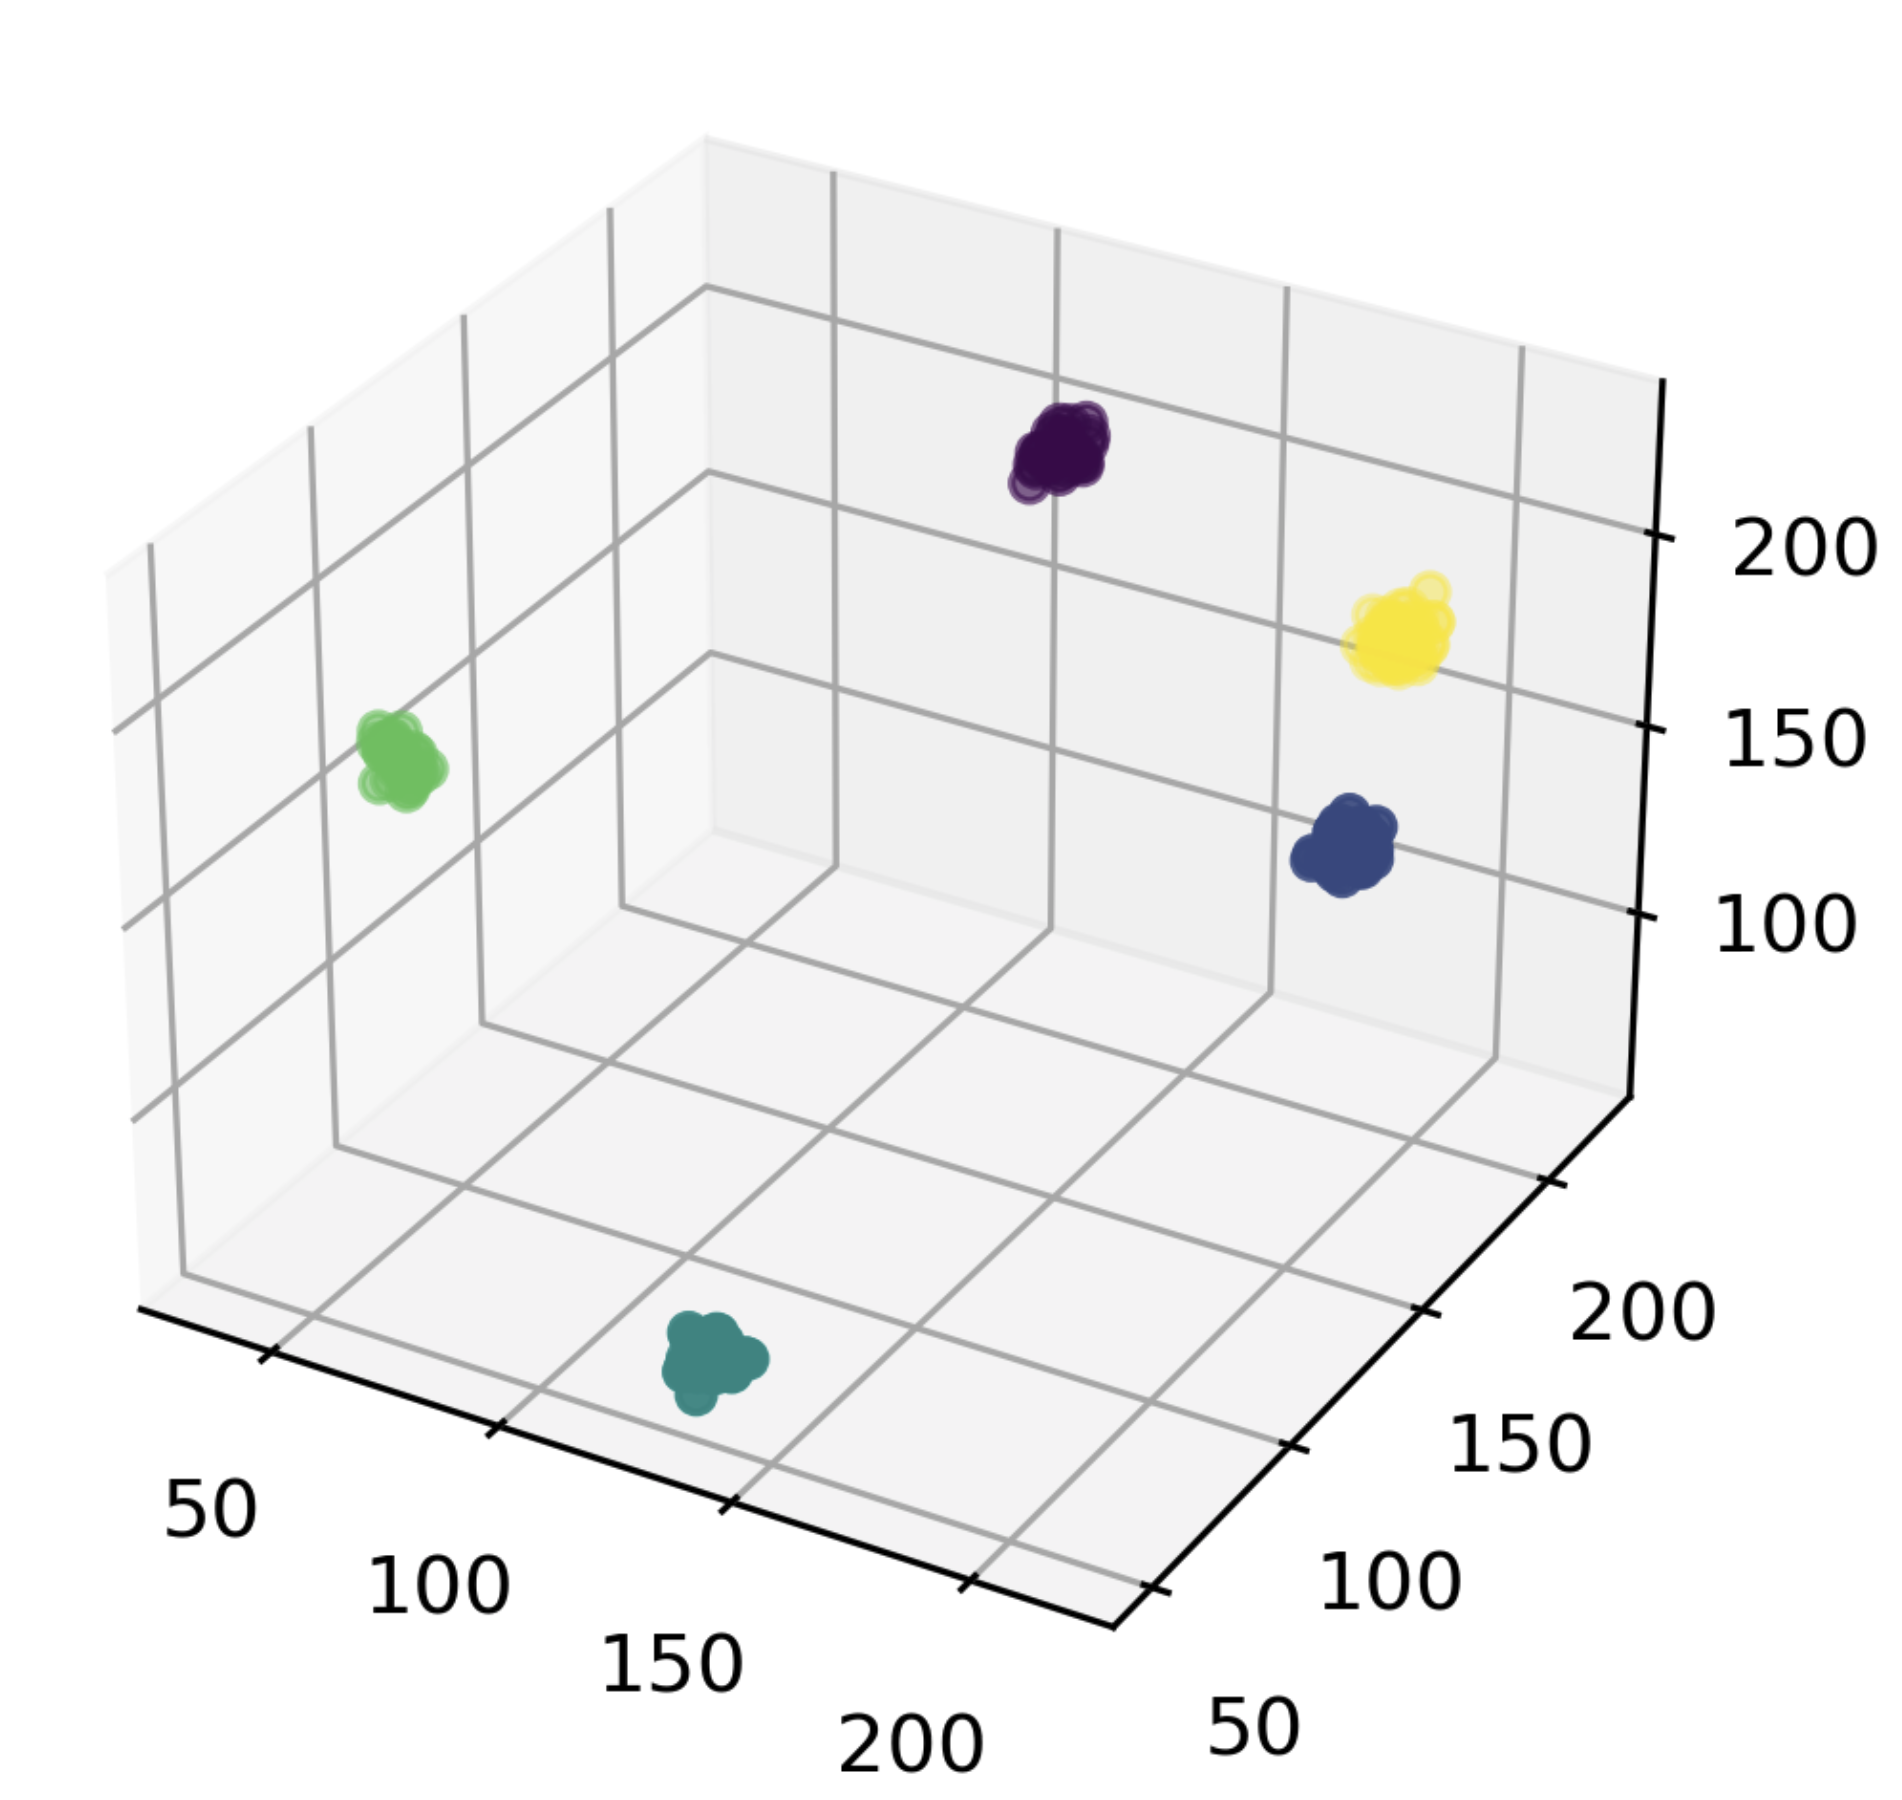
쉽게 클러스터링 할 수 있을만한 모양이 나왔다. k-means를 돌려서 잘 분류됬는지 확인해 본다.
from sklearn.cluster import KMeans

fig = plt.figure(dpi=300)
kmeans = KMeans(n_clusters=5)
ids = kmeans.fit(data)
ax=fig.add_subplot(111, projection='3d')
ax.scatter(data[:,0],data[:,1], data[:,2], c=ids.labels_)
plt.show()

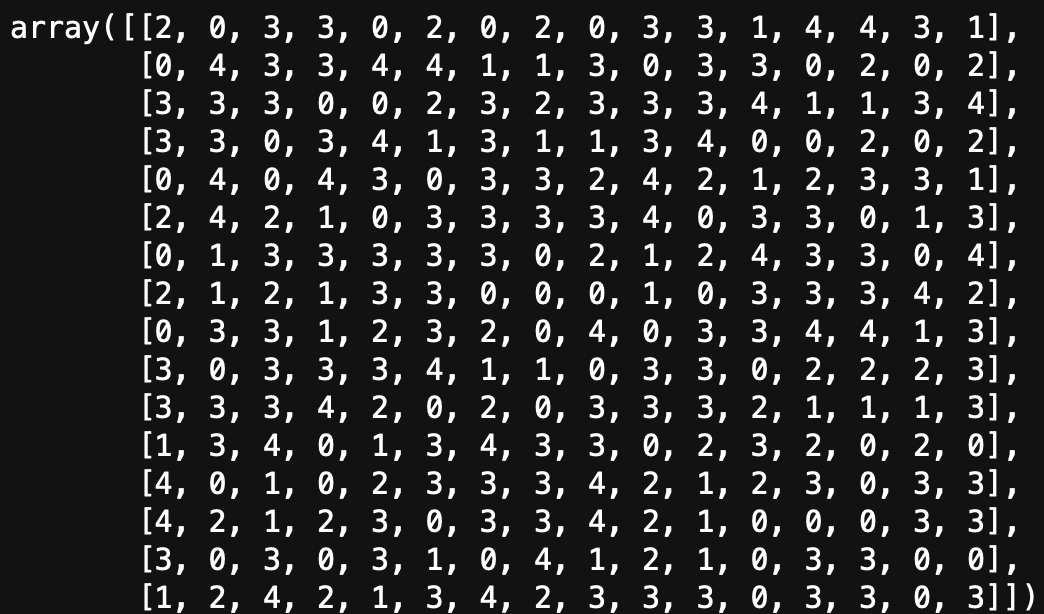
이제 matrix 형태로 바꾼다.
convdict = {}
for i,datum in enumerate(data):
    convdict[tuple(datum)]=ids.labels_[i]
convmat = np.zeros((16,16),dtype=int)
for i in range(16):
    for j in range(16):
        convmat[i,j] = convdict[tuple(data[i*16+j])]
convmat
